



![[:it]TRASPOL REPORT 1/25: The long-distance coach market in Europe | Year 2019 - 2024 [:en]TRASPOL REPORT 1/25: The long-distance coach market in Europe | Year 2019 - 2024 [:]](https://www.traspol.polimi.it/wp-content/uploads/2025/05/andreas-rasmussen-JKMcgMIDcnQ-unsplash-470x260.png)
[:it]TRASPOL REPORT 1/25: The long-distance coach market in Europe | Year 2019 – 2024 [:en]TRASPOL REPORT 1/25: The long-distance coach market in Europe | Year 2019 – 2024 [:]
[:it]
Milano, 08.05.2025.
Dopo oltre due anni di intenso lavoro, oggi pubblichiamo la prima edizione del report “The long-distance coach market in Europe | Year 2019 – 2024”, prodotto in collaborazione con la piattaforma Checkmybus.com. Il report è un upgrade del nostro precedente rapporto “Italian Long-Distance Coach Transport Market Report” pubblicato in numerose edizioni da TRASPOL tra il 2017 e il 2021.


Questo rapporto è l’unico osservatorio indipendente sui prezzi autobus e ora copre l’intero continente europeo, Turchia inclusa. Ambisce a diventare il punto di riferimento per l’industria e sarà (speriamo!) pubblicato annualmente.
Lo studio è basato su un enorme campione di prezzi raccolto per 6 anni dalla piattaforma e descrive il profilo degli utenti autobus, i prezzi, le rotte principali e le località più richieste. L’intero dataset è stato pulito per assicurare la massima affidabilità dei risultati e geolocalizzato per permetterci di mappare il mercato. Ecco alcuni contenuti importanti della prima edizione:
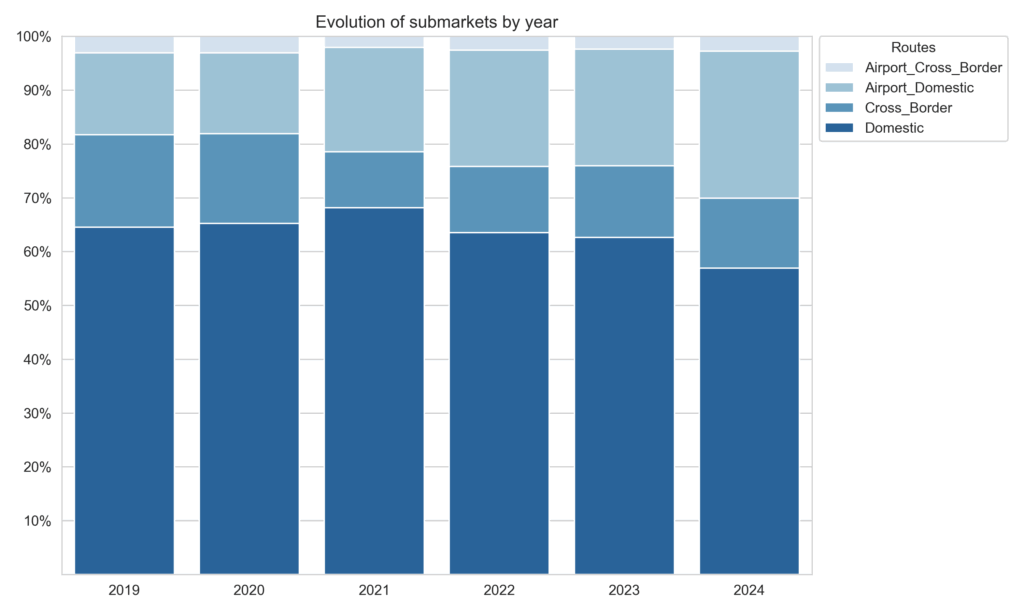
- Classifichiamo le OD in tre sotto-mercati: domestic intercity, cross-border intercity e servizi verso un aeroporto. Escludiamo le relazini brevi (<50km per gli IC, <20km per le aeroportuali). La principale evoluzione è la riduzione relativa del traffico intercity (da 81.7% a 69.9% incluso il cross-border) e il corrispondente aumento delle connessioni aeroportuali domestiche (da 15.2% a 27.3%). Il traffico internazionale, pesantemente influenzato dal covid, ha recuperato molto lentamente rispetto ai segmenti domestici dal 2022, ma è ancora sotto del 20% rispetto all’era pre-covid.
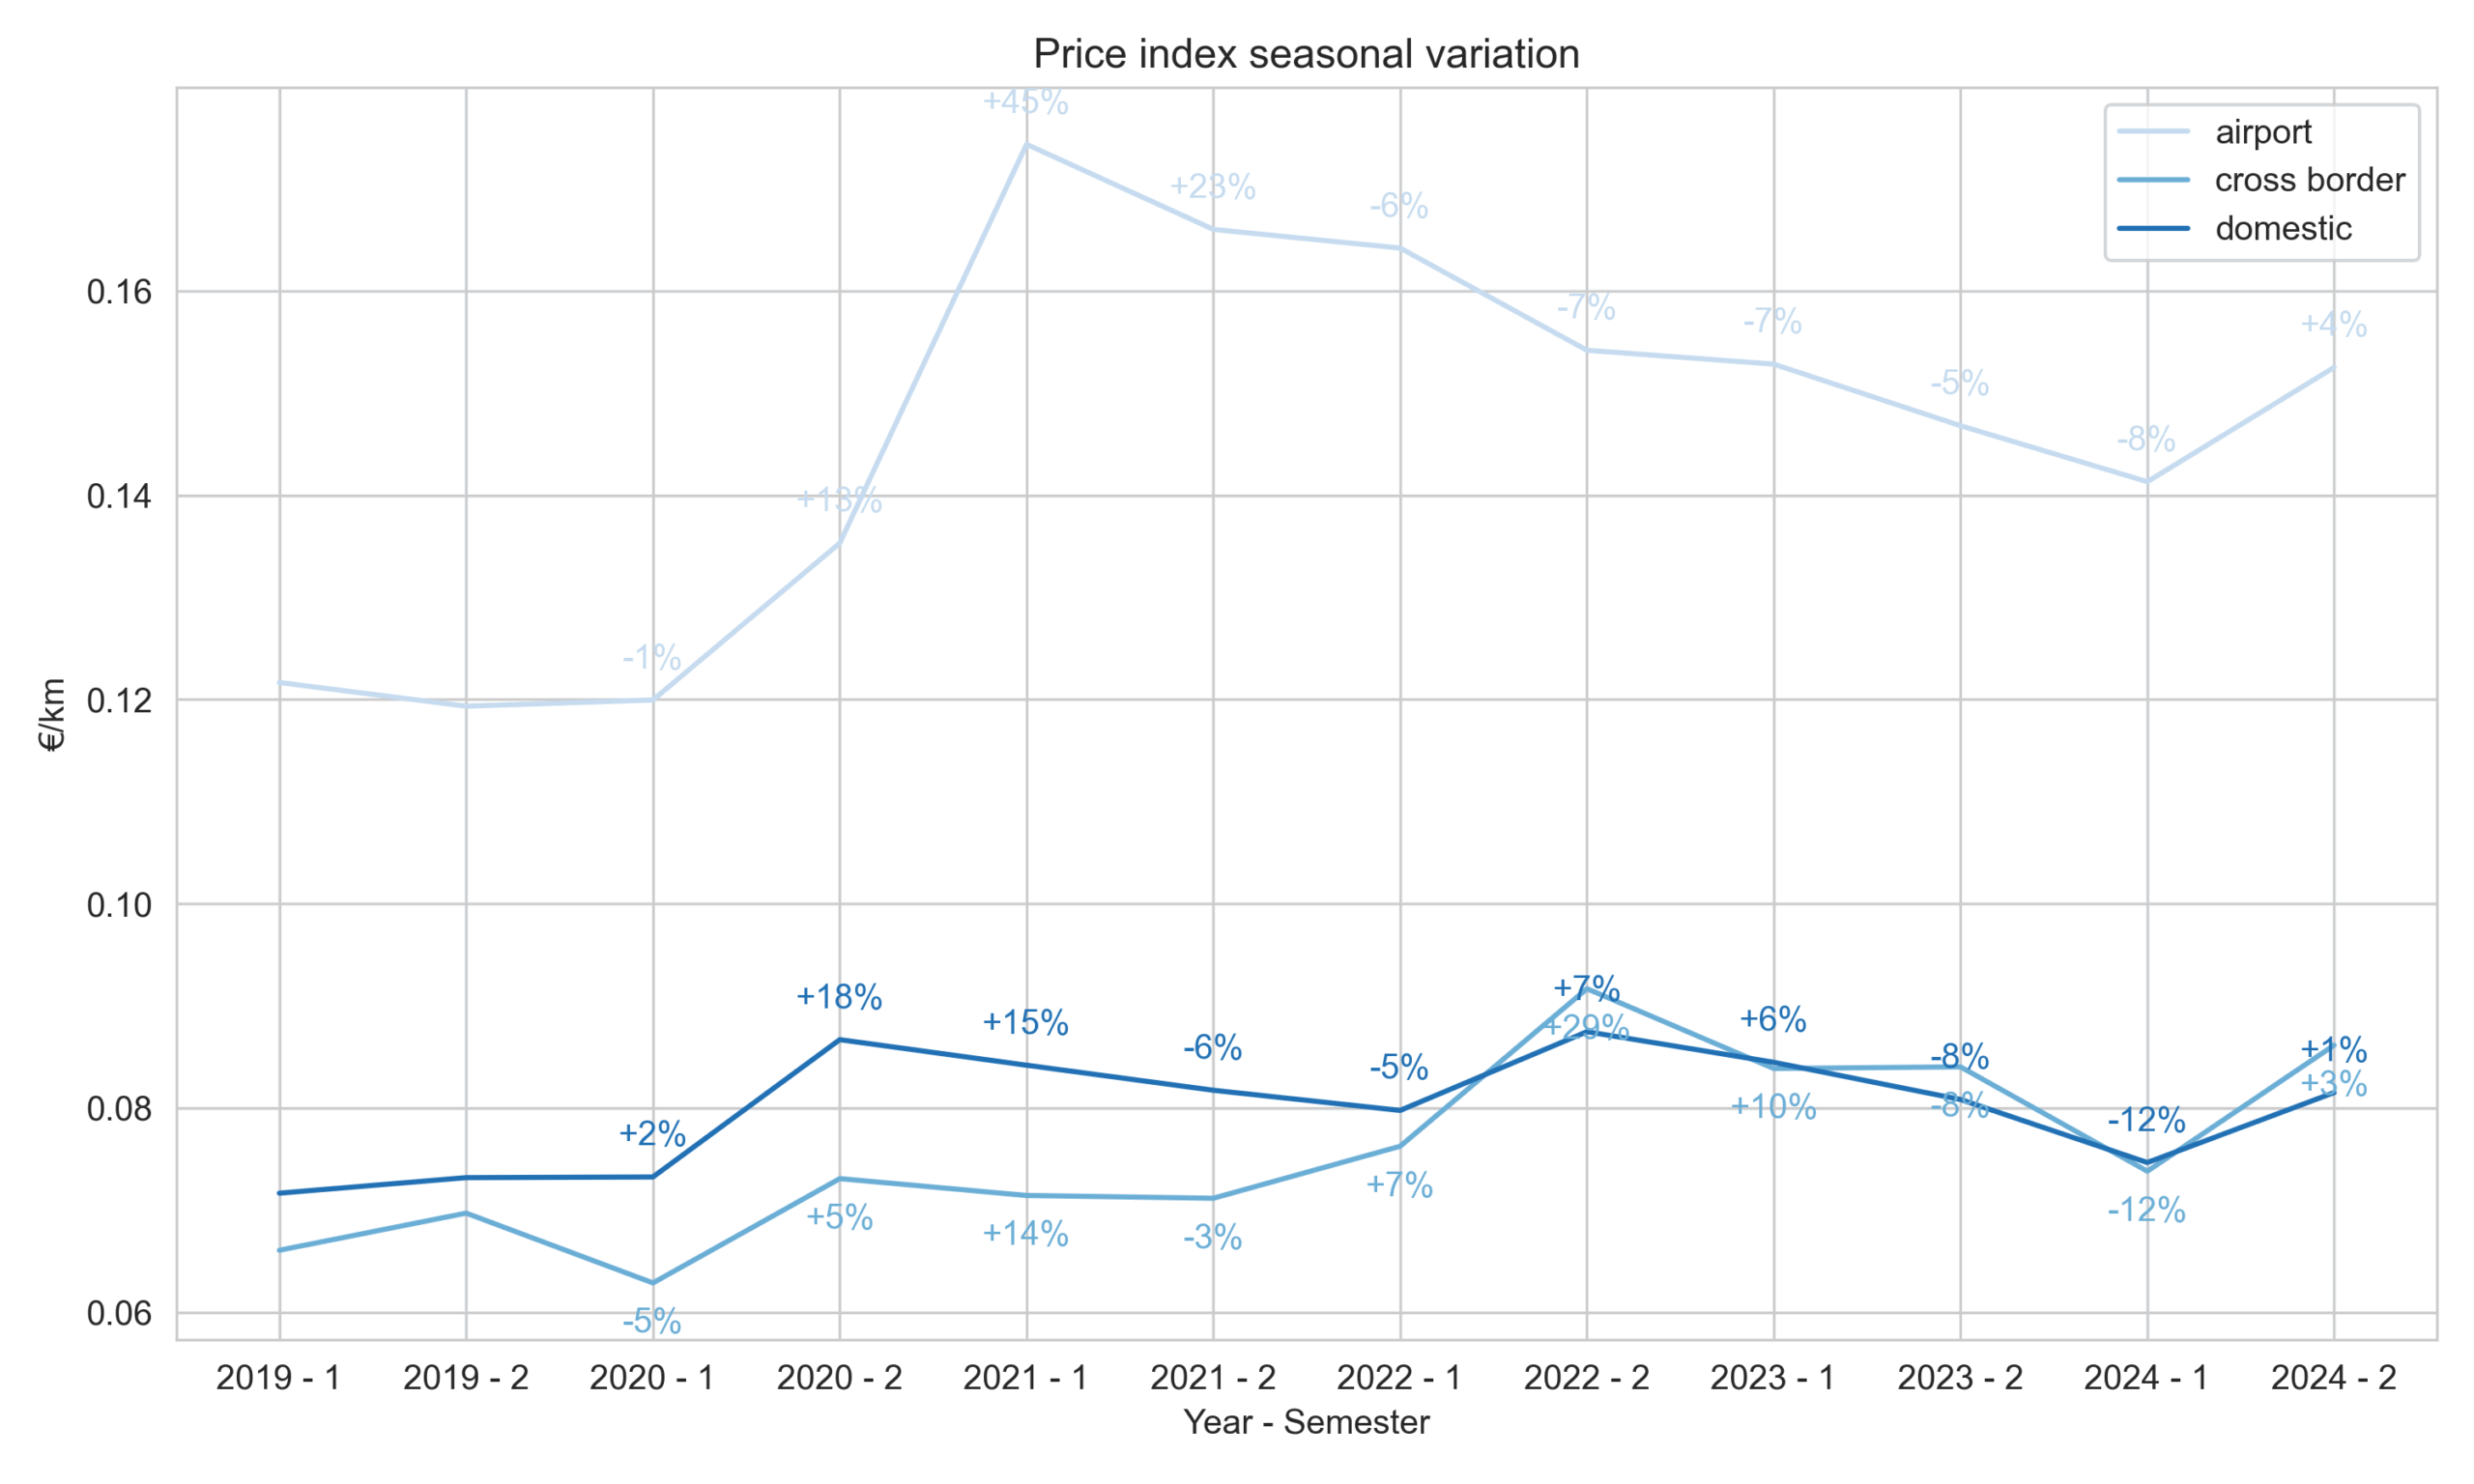
- L’indice dei prezzi (€/km) è cresciuto sostanzialmente (+15%) in 5 anni (2024 vs. 2019), ma in un modo differente nei tre sotto-mercati e con quello aeroportuale in crescita maggiore. Il 2024 è in media leggermente sotto il 2023 (-3%), a causa della forte riduzione di prezzo del solo primo semestre.
- Abbiamo calcolato anche due indicatori di concentrazione del mercato: la quota dei top-3 carriers per paese e il numero medio di operatori per rotta, sempre per paese. Il paesaggio competitivo europeo è molto differenziato. Mentre nella maggior parte dei paesi i top-3 hanno più del 70% dei passeggeri (!), frazioni ancora maggiori si osservano in Olanda, Belgio e specialmente UK (top-3 sopra il 90%). Solo nell’Europa Orientale + Italia e UK, i passeggeri possono godere della concorrenza tra oltre 3 compagnie in media per rotta.
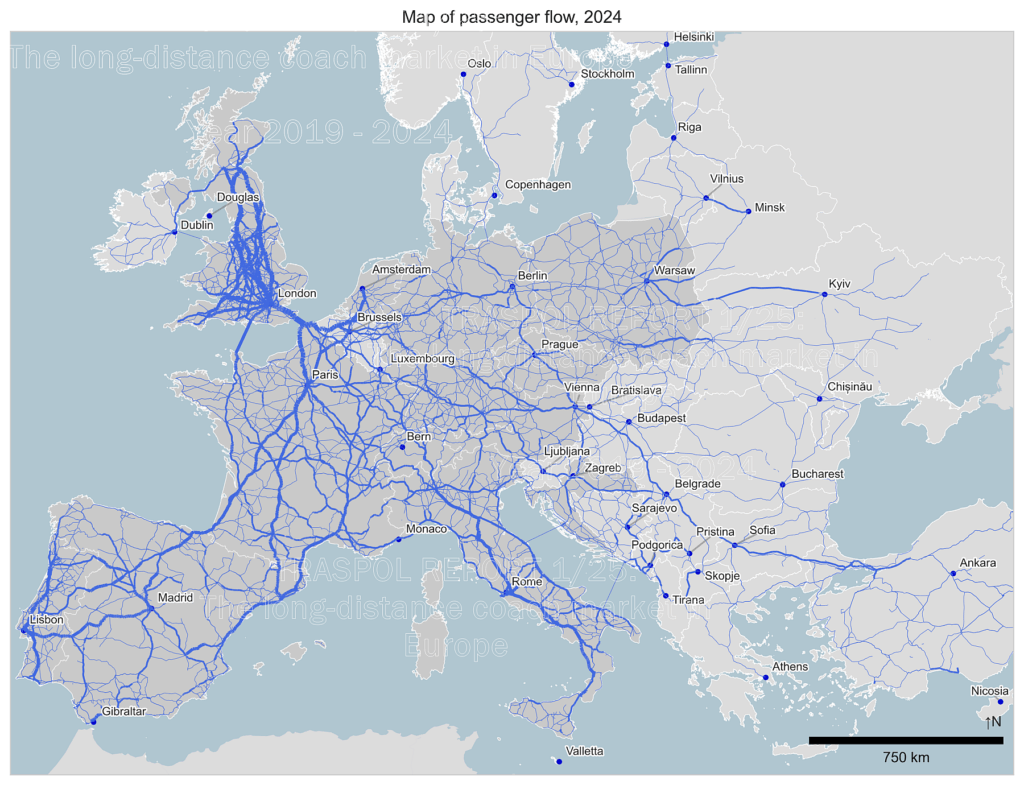
- Concludiamo con una mappa: dove viaggiano gli europei? Ecco la risposta: ovunque! La distribuzione dei passeggeri su autobus è molto più omogenea di quella su qualunque altra mappa simile che rappresenti flussi ferroviari o aerei. Il sistema autobus sembra più diffuso e meno polarizzato sui nodi urbani principali.
Potete scaricare il rapporto gratuitamente usando questo link:

[:]
[:en]
Milano, 08.05.2025.
After more than two years of intensive work, today we are publishing the first edition of the report “The long-distance coach market in Europe | Year 2019 – 2024”, in collaboration with the platform Checkmybus.com. The report is an upgrade of the “Italian Long-Distance Coach Transport Market Report” published by TRASPOL between 2017 and 2021.
This report is the only independent observatory on coach prices and now covers the entire European continent, including Turkey. It aims at becoming the reference for the industry and will (hopefully) be published every year.
The study is based on a huge sample of prices collected for 6 years by the platform and describes the profile of bus users, the prices charged, the main routes and the most requested locations. The entire dataset has been cleaned to ensure the maximum reliability of the results, and geolocated to let us map the market. Here some highlights of this first edition:
- We classify the OD pairs in three sub-markets: domestic intercity, cross-border intercity and OD pairs serving an airport. We exclude short routes (<50km for IC, <20km for airport). The main evolution is the relative reduction of intercity traffic (from 81.7% to 69.9% including cross-border) and the corresponding increase of domestic airport connections (from 15.2% to 27.3%). International traffic, heavily influenced by covid pandemics, has very slowly been recovering with respect to domestic segments since 2022, but it is still well below the 20% of the pre-covid era.
- The price index (€/km) has grown quite substantially (+15%) in five years (2024 vs. 2019), but in a different way for the three sub-markets, and with airport segment growing the most. 2024 is on average slightly lower than 2023 (-3%), due to the steep reduction of the first semester.
- We compute indicators for market concentration: share of top-3 carriers by country and average number of carriers per route, by country. The European landscape is very different. While in most of European countries top-3 operators have more than 70% of passengers (!), higher shares are found in The Netherlands, Belgium and especially UK (top-3 above 90%). Only in Eastern countries + Italy and UK passengers can enjoy > 3 average companies per route.
- Let’s end with a map: where are Europeans travelling? Here the answer: everywhere! European coach passengers are extremely more homogeneous than any other similar map representing rail or air flows. Coach system looks more widespread and less polarised on main urban nodes.
You can download the report for free using this link:
Beria P., Sorbona S. (2025). The long-distance coach market in Europe | Year 2019 – 2024. TRASPOL Report 1/25 & Checkmybus. Milano, Italy.
[:]

I commenti sono disabilitati, ma trackbacks e pingbacks sono abilitati.